Updated every 2 minutes - Visit our Live Stream for much more real-time activity. A simple Livestream Tutorial is here.
Full-Resolution (780 meters per pixel) 24-Hour Auroral Activity Night Mosaics. (LARGE images - produced daily).
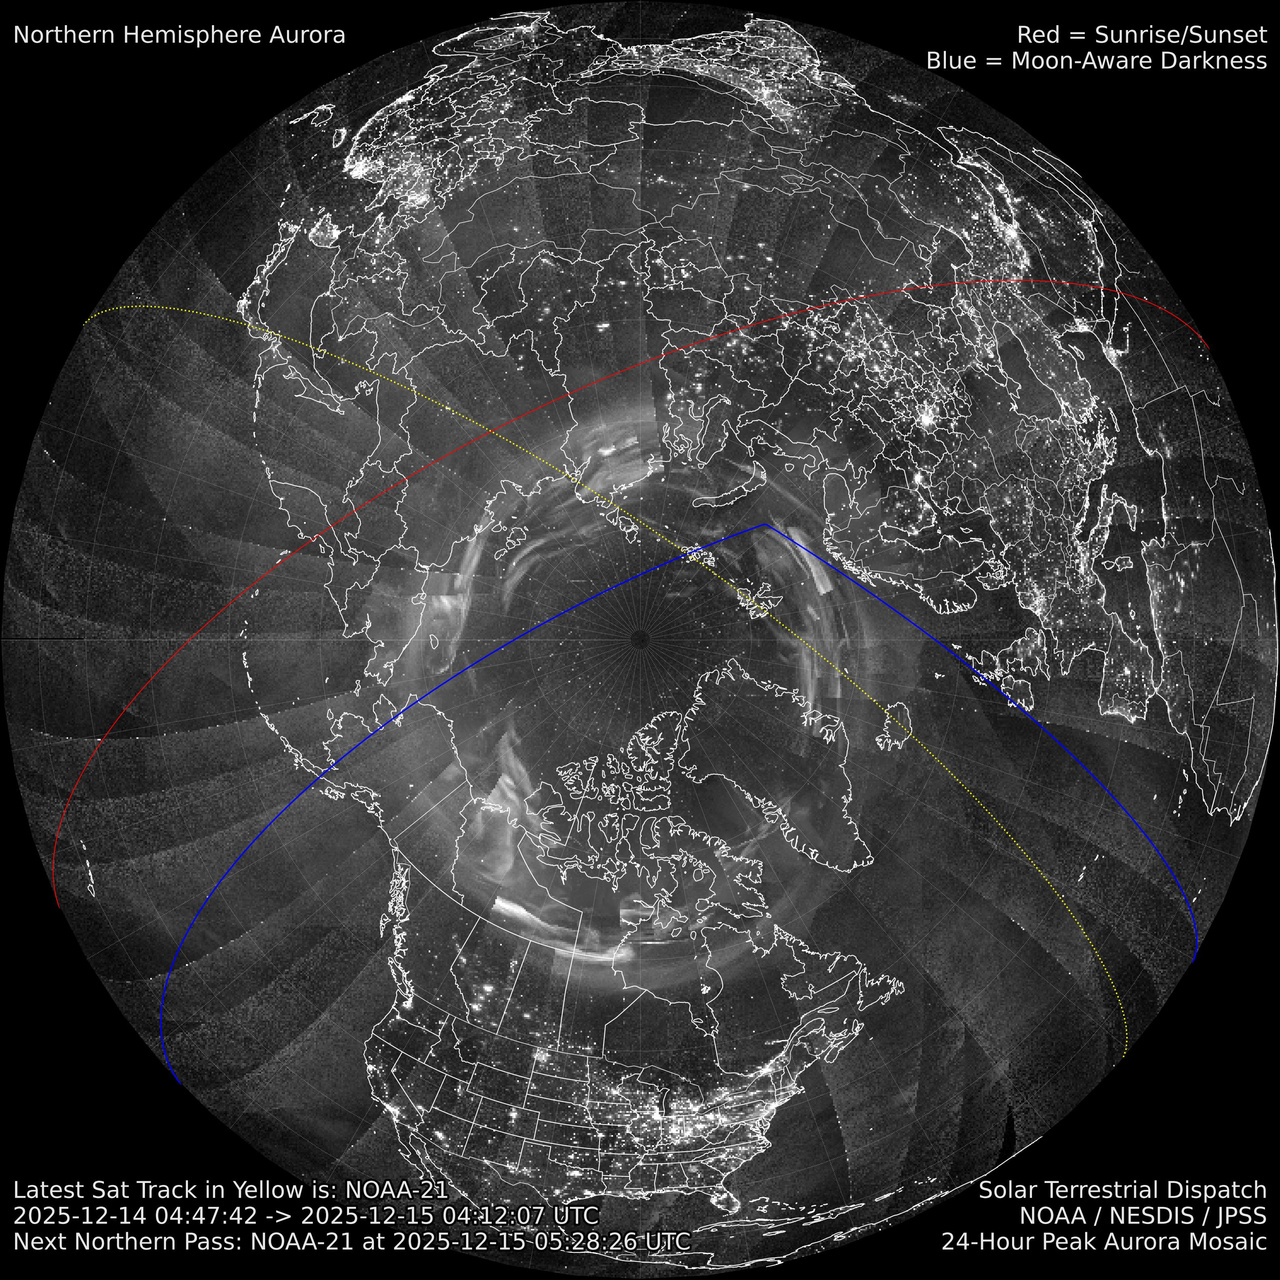
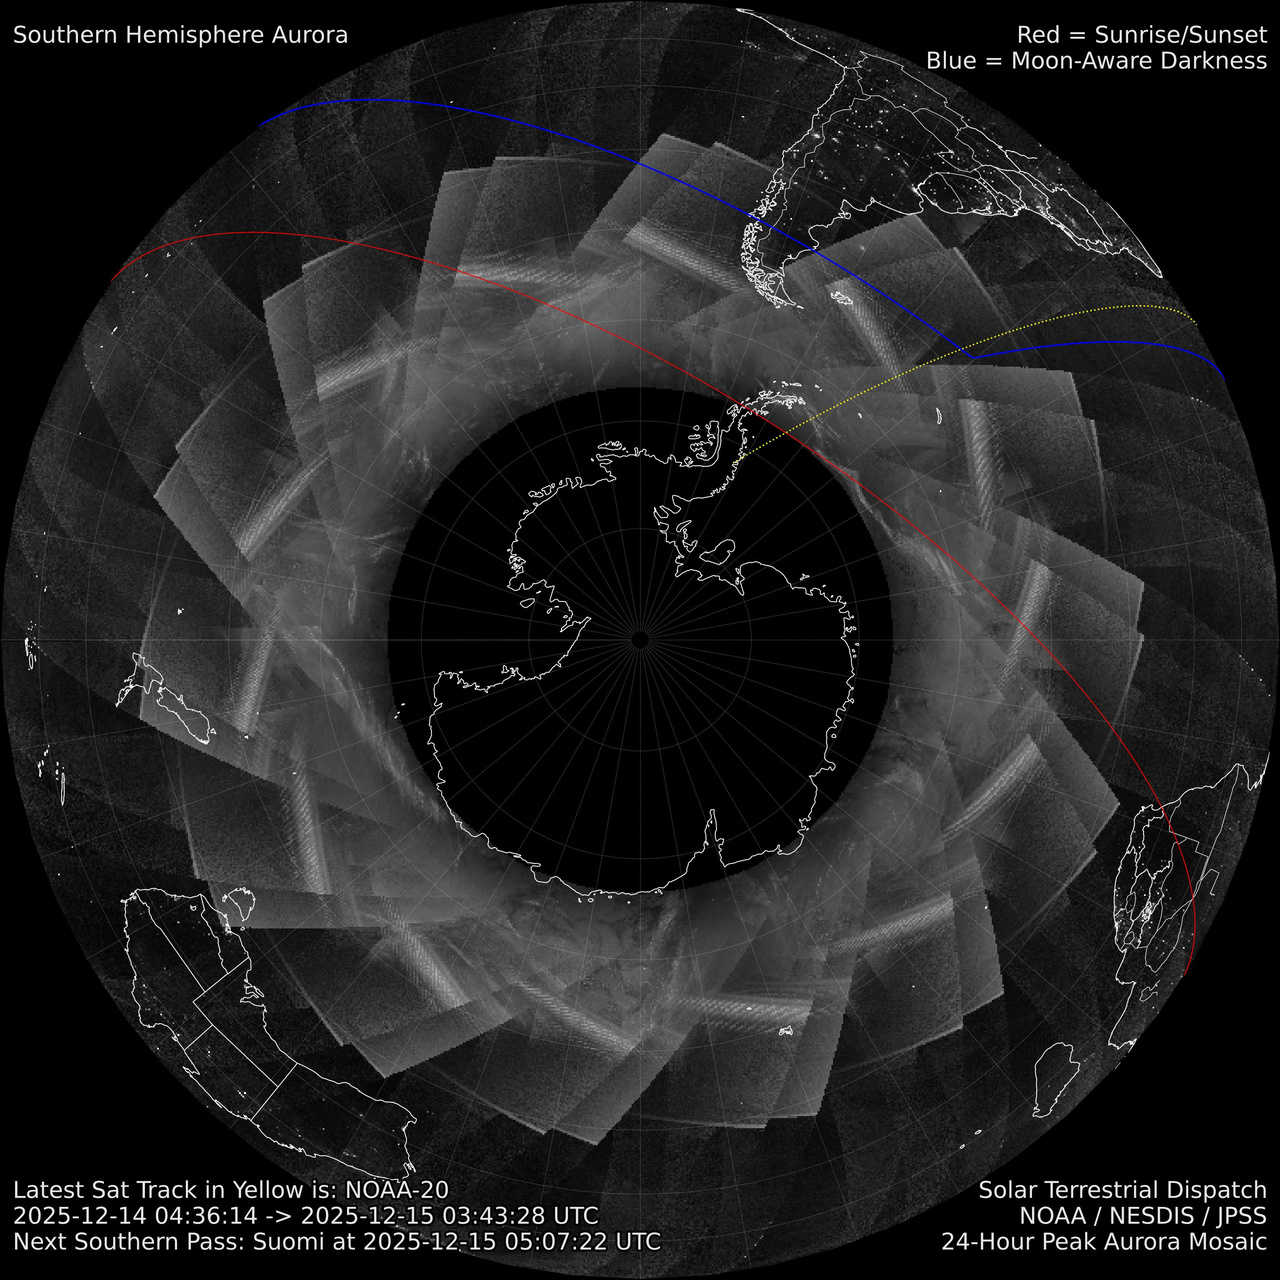
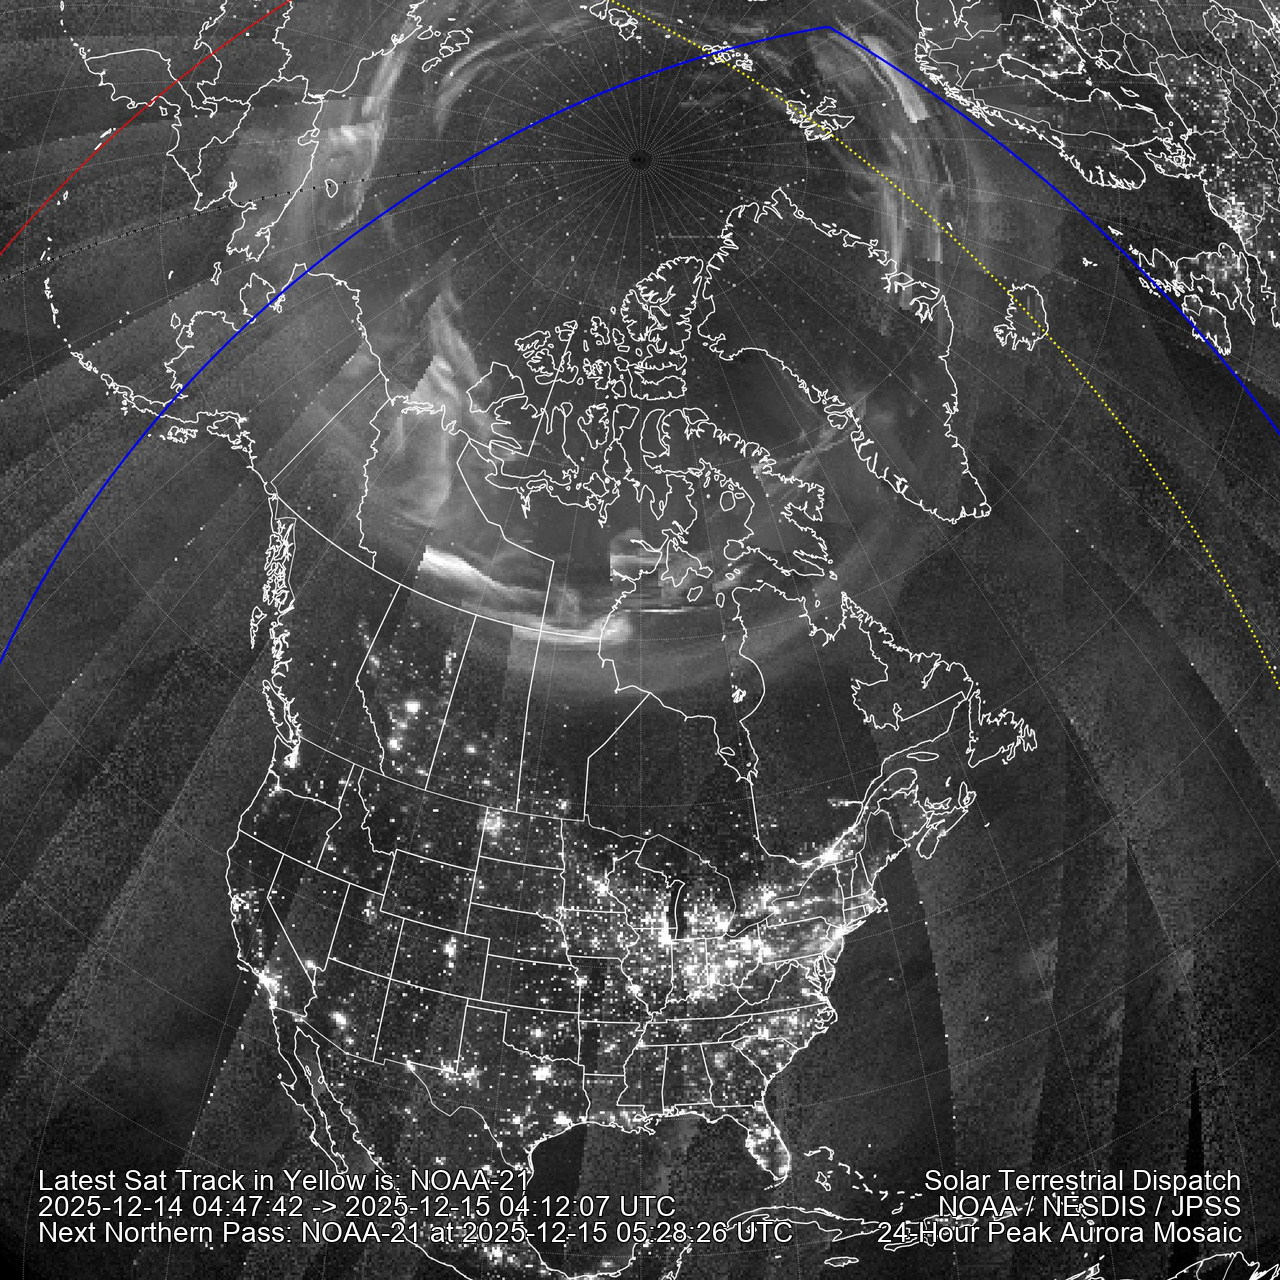
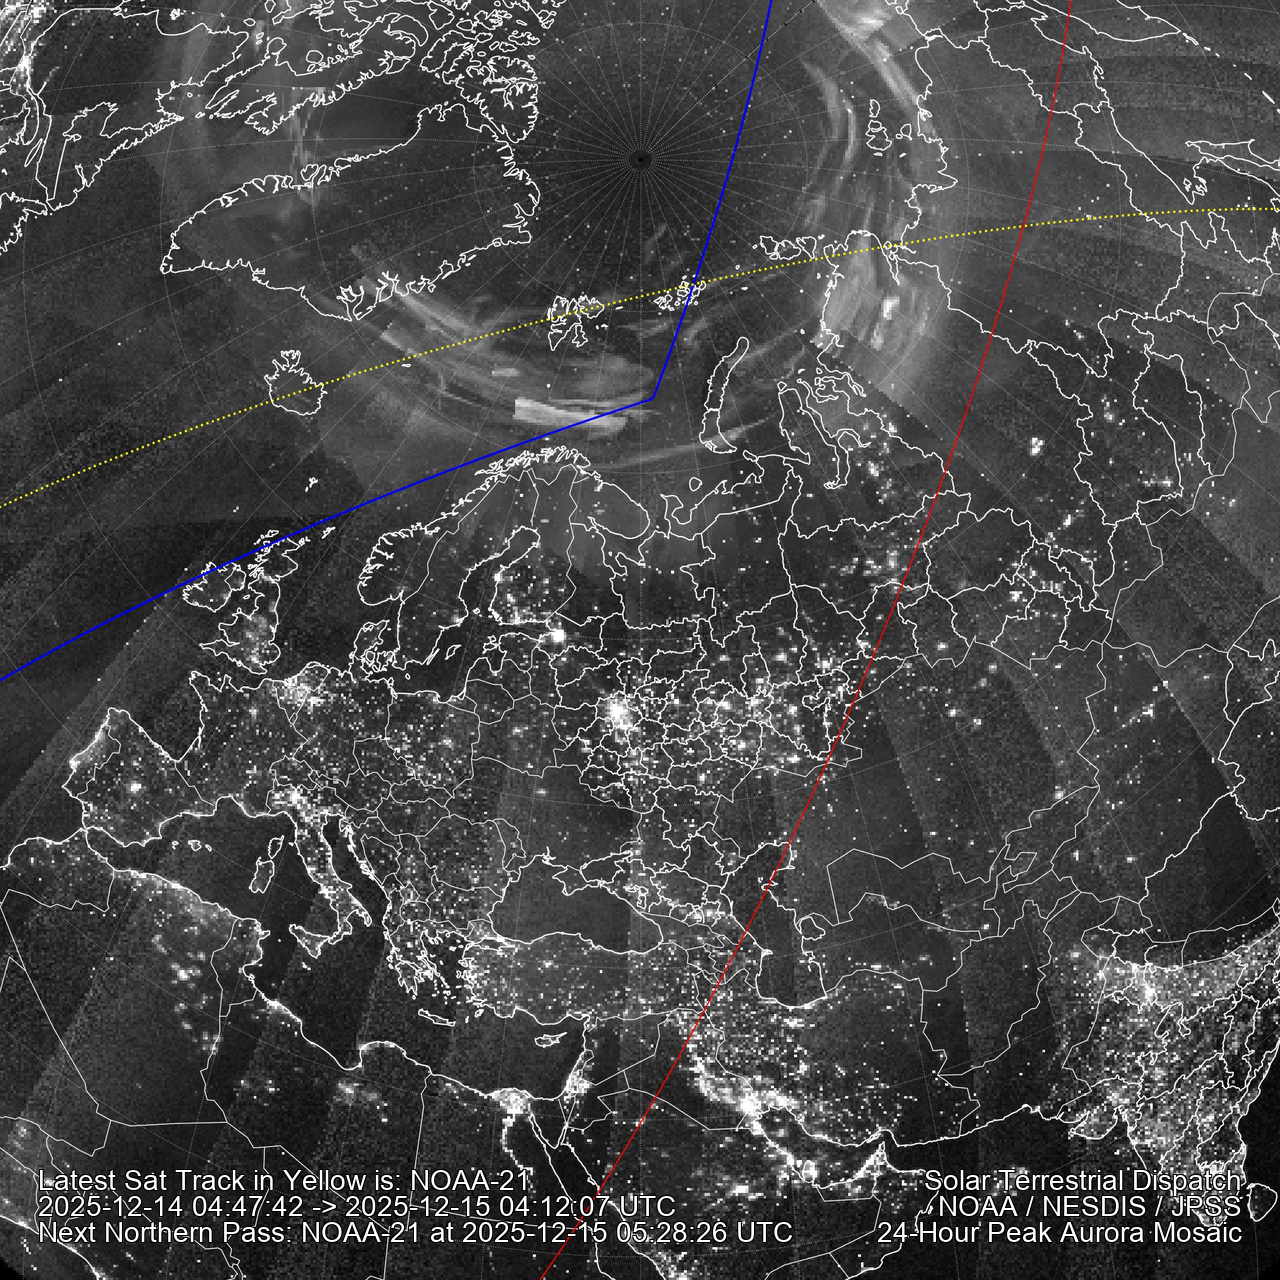
The first pair of mosaics below shows the strongest auroral activity during the night hours. The second pair shows the strongest auroral activity observed over the last 24 hours for North America and Europe. Near real-time snapshots of current activity are available on our live-stream. Only night-time data is used to create these mosaics. Because of this, during the polar summer you will see black areas over the poles, where the sun does not set and no night-time data is available.
|
|
|
|
Click Here for a quick visual tutorial. Aurora mosaics are created from all three polar passes of the NOAA-21/20/Suomi spacecraft. Data comes in strips. The red line marks where the sun is rising or setting at the time stamp of the latest data (marked after ->). The area inside the blue line marks darkness and no lunar interference (the moon has not risen). The dotted yellow line shows the center of the latest satellite pass so it is easy to tell which swath is the current one. City lights are visible. Click here for Southern hemisphere polar images.
|
|
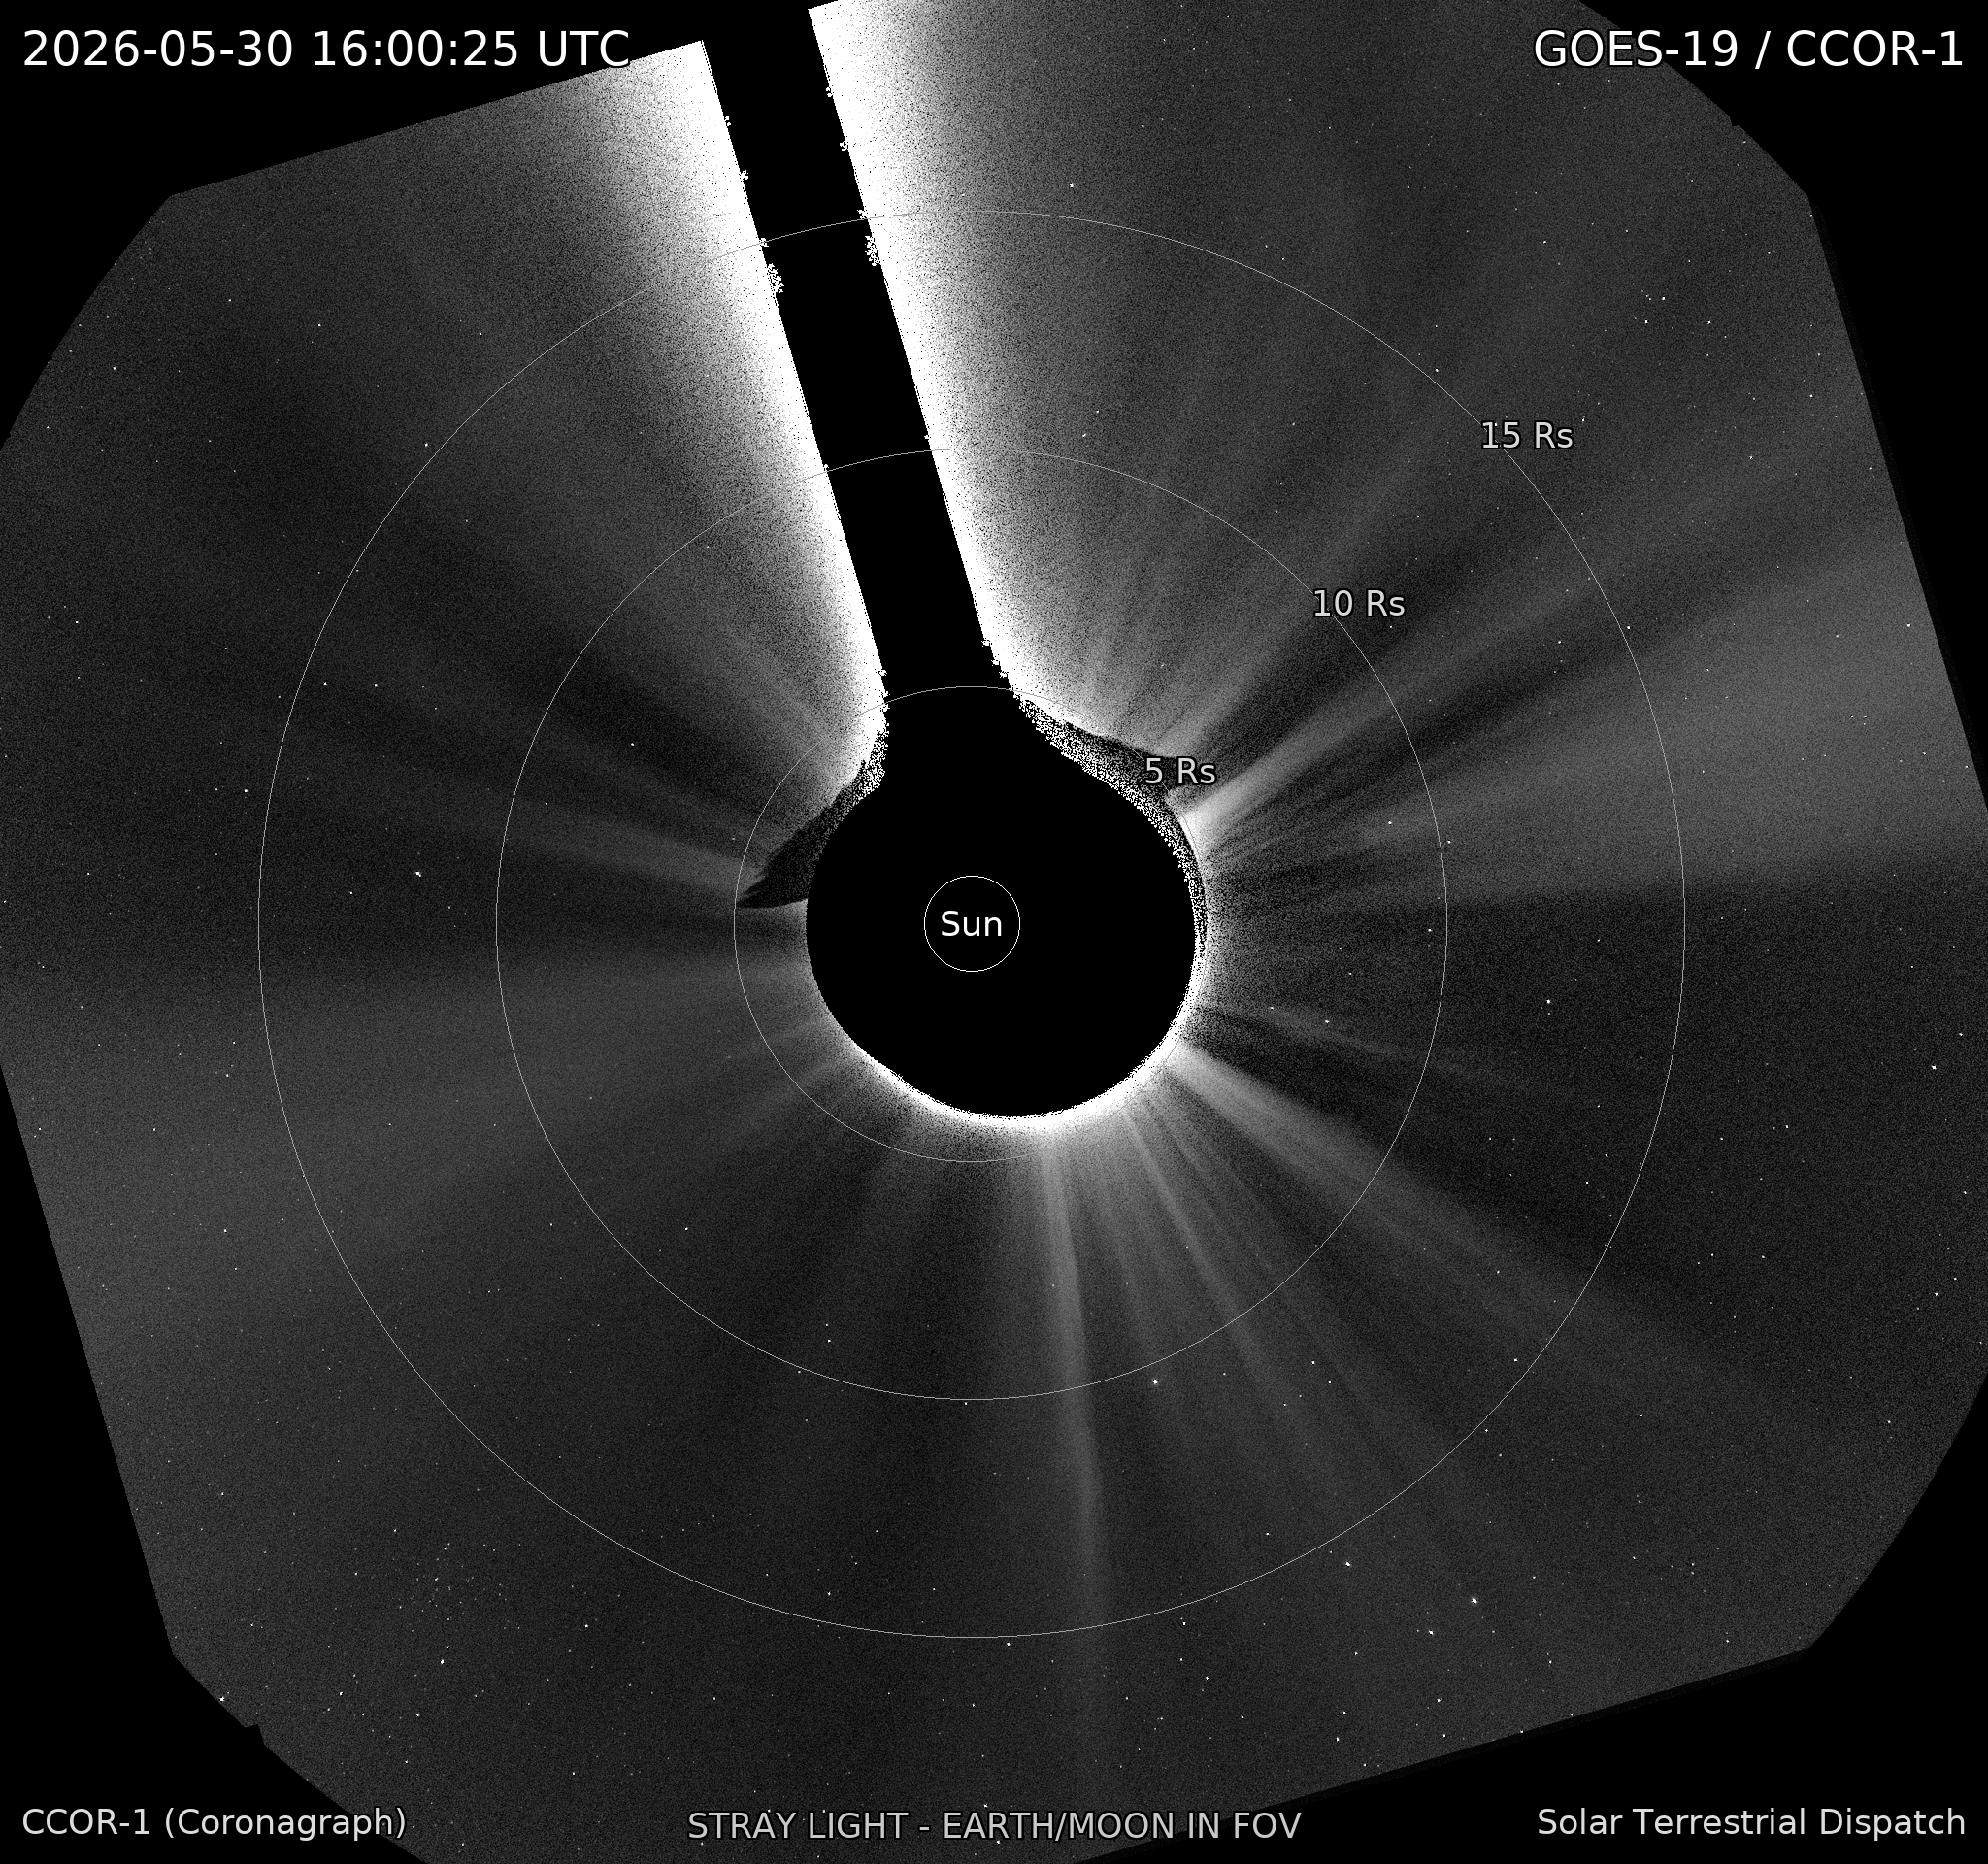
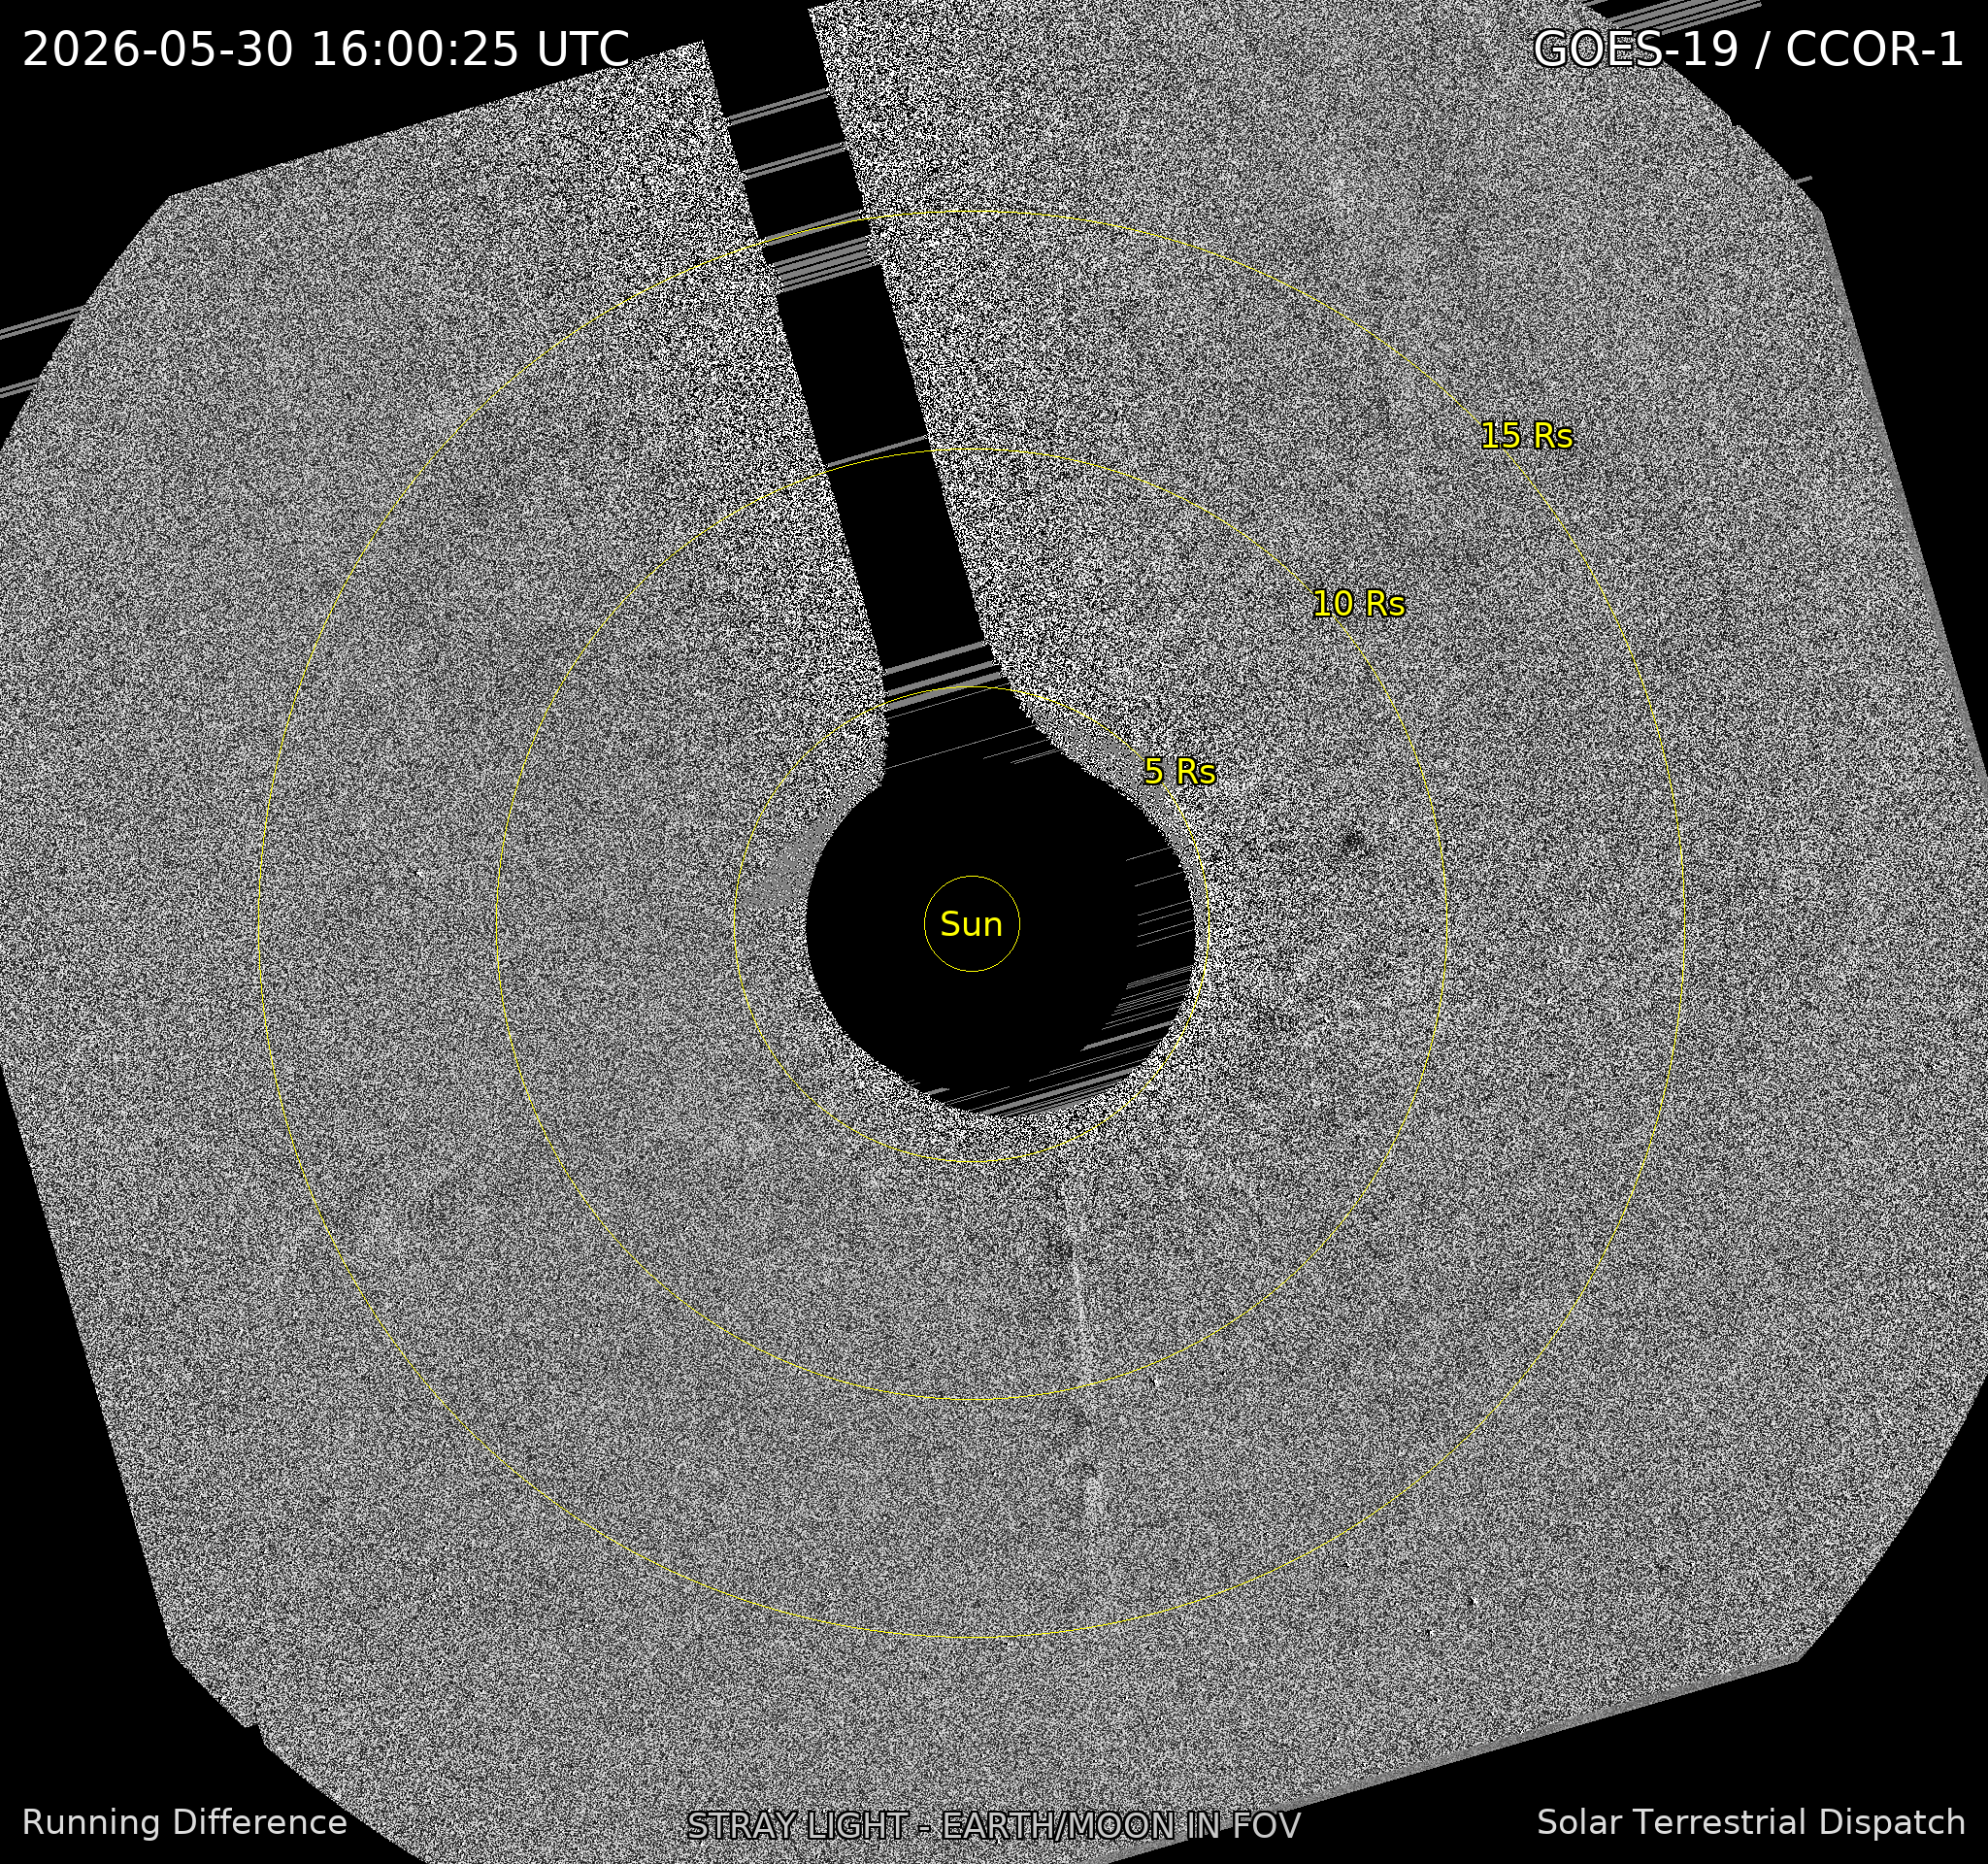
The image above-left is a clear-sky coronagraph view from GOES-19 CCOR. The sun is blocked in the center so faint objects around it can be seen, including stars, planets, and sometimes comets. The image above-right is a running-difference view, which compares recent images so moving features, such as coronal mass ejections, are easier to see. Click the images for larger versions.
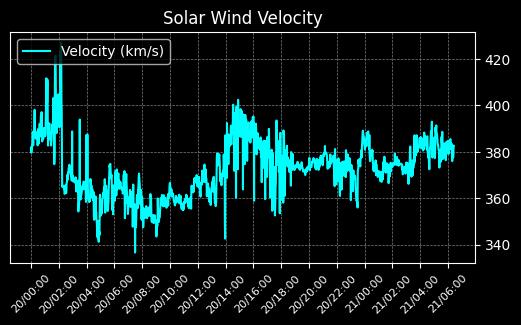
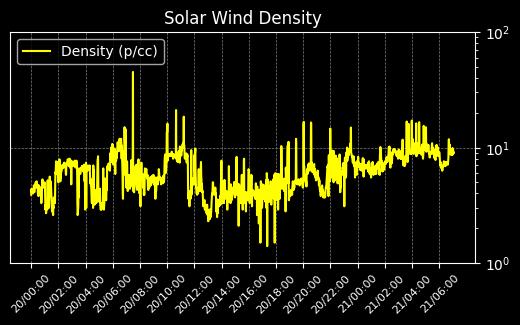
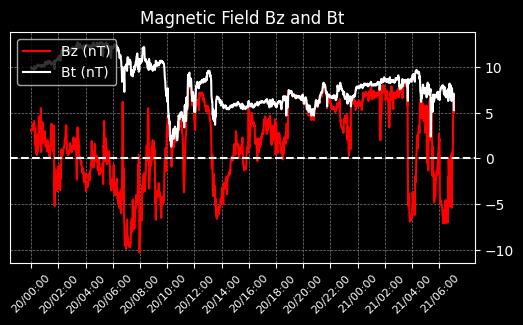
| Solar Wind Velocity | Solar Wind Magnetic Field |
|---|---|
| V=488 km/sec, Density= +3.3 | Bz= +2.9nT, Bt= +4.6nT |
|
|
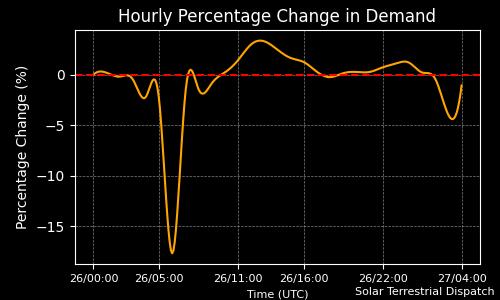
| Electrical Power Grid Supply vs Demand | Change in Power Grid Demand |
|---|---|

Negative values: demand exceeds generation, requiring use of spare capacity or imports. This is provisional data and is often revised as more utilities report during the day. |
|
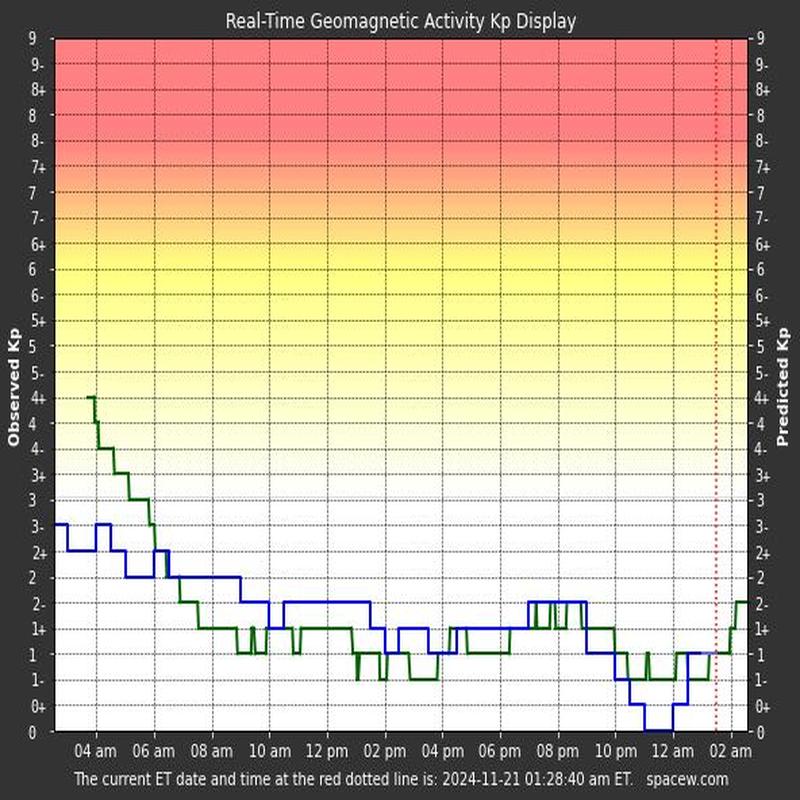
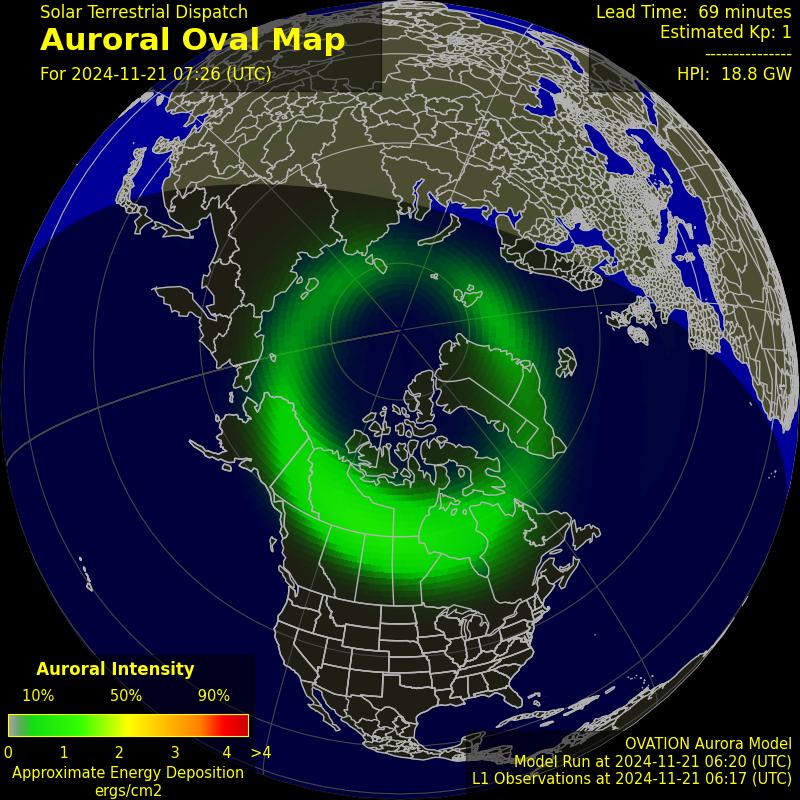
| Northern Lights Map | Geomagnetic Activity Predictions |
|---|---|
|
|
Last Kp Value: 2+
Last Hourly Kp's: 2+ 2+ 2- 2o 2- 1+
Predicted Kp Value: 2- at 2143 UTC.